Cement + CCUS Outlook 2025
Lower-clinker recipes and smart carbon capture are now the two levers every kiln in India and the Gulf must pull
1 Why cement is still a climate outlier
Ordinary Portland cement (OPC) releases 0.55 – 0.90 t CO₂ t⁻¹ because limestone is literally baked out of its carbon. Two levers dominate any credible plan:
- Lower the clinker-to-cement ratio (C/C). Swap in fly-ash, slag or calcined clay.
- Capture what remains. Even an aggressive blend leaves > 50 % “process CO₂” that only CCUS—or new chemistries still at pilot scale—can eliminate.
A new CEEW study backs that up: 56 % of residual emissions from India’s steel-and-cement complex remain “hard” even after energy-efficiency and alternative fuel shifts, so CCUS isn’t optional.
Planning a capture-ready kiln?
- Book a 30 min kiln call-back
- e-mail sales@ssgaslab.com
- or dial +91-124-46 XXXXX
2 2025 policy pressure—no more wiggle room
| Jurisdiction | 2025 change | Impact |
|---|---|---|
| India – BIS draft amendment to IS 269 | Signals medium-term C/C ≤ 0.65 for OPC-43 by 2026. | Pushes manufacturers toward blended cements and capture for residual kiln gas. |
| UAE – Net-Zero 2050 Strategy (rev. Jan 2025) | Tags cement a “priority hard-to-abate” sector; fast-track permits for plants adding CCUS or WHR. | Couples licensing speed to capture commitments; interim goal 14 Mt CO₂ y⁻¹ captured by 2030. |
Combined, these rules force plants to address the remaining 56 % hard CO₂ the CEEW model highlights.
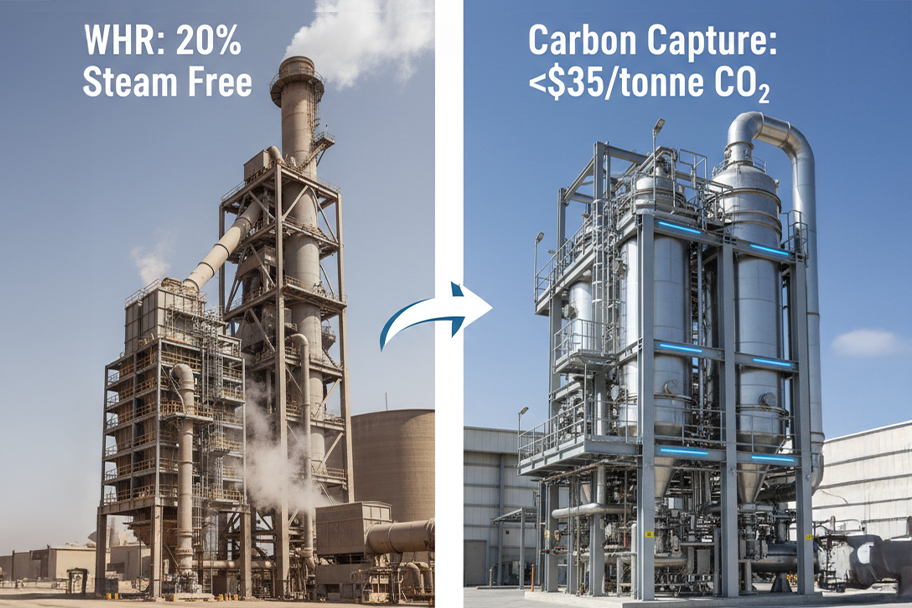
3 Waste-heat recovery: capture’s cheapest ally
Dry-process kilns vent 200–350 °C gas. Sharjah Cement’s 9 MW WHR unit already avoids ≈ 70 000 t CO₂ y⁻¹ and can feed half the steam for a 0.15 Mt y⁻¹ capture skid. Field data show WHR + capture cuts external steam up to 20 %.
Need a quick WHR + capture pay-back?
- Talk to our cement specialist
- e-mail sales@ssgaslab.com
- or call +91-124-46 XXXXX
4 What 2025 capture economics really look like
| Capture scope | Installed CAPEX* | OPEX band | Net cost after tax shields† |
|---|---|---|---|
| 0.4 Mt y⁻¹ retrofit | US $120–160 M | US $17–22 t⁻¹ | US $35–55 t⁻¹ CO₂ |
| 0.1 Mt y⁻¹ modular skid | US $60–70 M | US $22–28 t⁻¹ | US $45–60 t⁻¹ CO₂ |
*Includes WHR tie-ins; excludes pipeline.
†India 40 % Y1 depreciation or UAE 50 % two-year write-off; aligns with IEA curves.
5 India vs UAE — two divergent but real trajectories
| Metric | Andhra Pradesh blended line | Ras Al Khaimah integrated plant |
|---|---|---|
| Starting C/C | 0.78 | 0.75 |
| 2026 target C/C | 0.66 | 0.70 |
| Planned capture | 0.12 Mt y⁻¹ (kiln stack) | 0.15 Mt y⁻¹ (pre-calciner + kiln) |
| Steam source | 100 % WHR | 50 % WHR / 50 % aux boiler |
| Simple pay-back | 5–6 yr | 4–5 yr |
(Proprietary heat balances withheld; numbers rounded to 5 % bands.)
6 FAQ – what non-engineers ask most
Q: What exactly is C/C?
Short answer: Clinker mass ÷ cement mass; 0.65 means 650 kg clinker per tonne cement.
Q: Can India finance small kilns?
Short answer: Yes—SIDBI Green-Equipment loans ≤ 8 % for projects < ₹150 cr.
Q: Is capture ever net-negative?
Short answer: Yes—if kiln fuel is biogenic; CAPEX similar, credits far higher.
Q: Will hydrogen prices affect kiln capture?
Short answer: Not until hydrogen < US $1 kg⁻¹; CEEW shows capture beats CCU fuels until that threshold.
7 Key take-aways
- Policy now has hard numbers: India’s draft C/C ≤ 0.65; UAE wants 14 Mt captured by 2030.
- Waste-heat trumps new boilers: up to 20 % steam saved.
- Net capture cost: large retrofits clear at US $35–55 t⁻¹ after tax perks.
- Five-year pay-backs already real when food-grade or EOR off-takes exist + concessional finance.
Need a kiln-specific decarb plan?
- Book your 30-min consult
- e-mail sales@ssgaslab.com
- or call +91-124-46 XXXXX
References
- BIS draft amendment IS 269 (OPC-43).
- UAE Net-Zero 2050 Strategy update.
- WHR case study, Sharjah Cement (2015).
- IEA CCUS cost curves, 2024.
- Hard-to-abate residual share (56 %) & hydrogen threshold, CEEW 2025 report.